Breaking down Kentucky basketball’s 2022-2023 shot chart
Everyone go find a stick and the closest dead horse. We have some beating to do when it comes to critiquing Kentucky’s shot selection from the 2022-23 season.
If you are the type to move on quickly from a painful chapter and are already fully invested in the hype of next year’s team, especially following the show the new recruits put on at the McDonald’s All-American Game, then, by all means, exit now and keep your optimism high. However, if you’re like me and still feel the need to wallow in the coulda-woulda-shoulda past for an unnecessarily long time, then follow me down this dimly-lit path of Kentucky basketball shot chart analytics.
First, a major caveat: Kentucky finished 17th in Kenpom’s Adjusted Offensive Efficiency category, so if you’re in the camp of “Long 2s can still win ballgames,” then grab onto that ranking and hold on it with the strength of Oscar Tshiebwe grabbing a rebound. Kentucky ranked second in this category in the SEC behind Missouri and ahead of league champ, Alabama, which embraces the modern basketball mindset of maximizing field goal attempts at the rim and from behind the arc as much as anyone in college basketball.
Of course, it is certainly possible to win the way Kentucky plays. John Calipari has done it so much in the past, the basketball overlords put him in the Hall of Fame. The fact is, however, the game has changed, and coaches now lean heavily into freshly-available statistical probability rather than embracing the playbooks of old.
Why not follow the numbers and give yourself the best statistical advantage you can? This won’t come as a shock, but Kentucky did not exactly do that this year.
Thanks to CBBAnalytics.com for their advanced charts; let’s dive in.
Kentucky’s shot chart
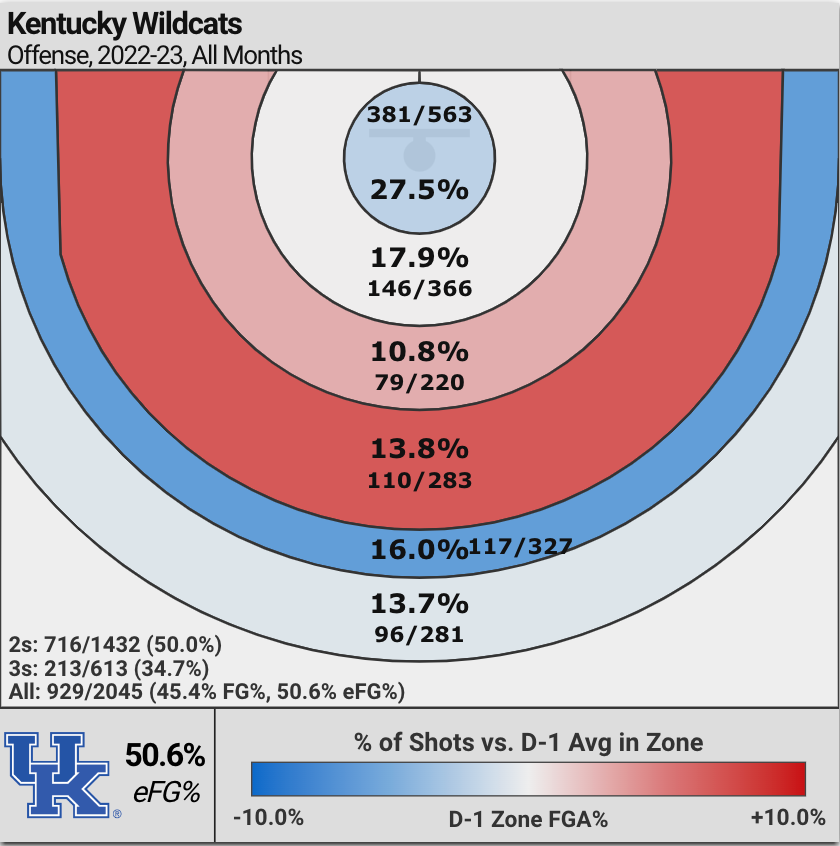
This chart depicts Kentucky’s shot selection this season. Starting with the inner circle and working outwards, the zones correlate to shots at the rim, 4 to 10 feet, 10 to 15 feet, 2s greater than 15 feet, 3s shorter than 25 feet, and 3s between 25 and 30 feet. The percentages indicate the number of shots taken from each zone compared to all of Kentucky’s field goal attempts.
The darker the red, the further above the D1 average. The darker the blue, the further below the D1 average.
For what it’s worth, Kentucky shot four 3s further than 30 feet that are not represented here, which is why the percentage totals add up to 99.7%. They missed them all.
If modern basketball maximizes layups and 3s, a quick glance at this chart tells you Kentucky does the complete opposite of that. The only shot distances where Kentucky shows up blue (below D1 average in the percentage of their shots taken from these areas) are at the rim and behind the arc.
Worse yet, they are borderline Cardinal-red in the 2-pointers-longer-than-15-foot zone, and everyone would agree that is an ugly shade of red.
The average D1 team only shot 7.1% of their shots from this range meaning Kentucky was nearly double that at…

- Advertisement -
Read More: Breaking down Kentucky basketball’s 2022-2023 shot chart 2023-03-31 00:00:15
- Advertisement -